
Global Distribution of UFO Sightings 1910-2013

Where are you most likely to see a UFO? More importantly, where are they most likely to see you?

Thankfully, the National UFO Reporting Centre (NUFORC) have diligently compiled and curated a dataset of over a century of global UFO sightings. The data has been processed, cleaned, and uploaded by timothyrenner at data.world.

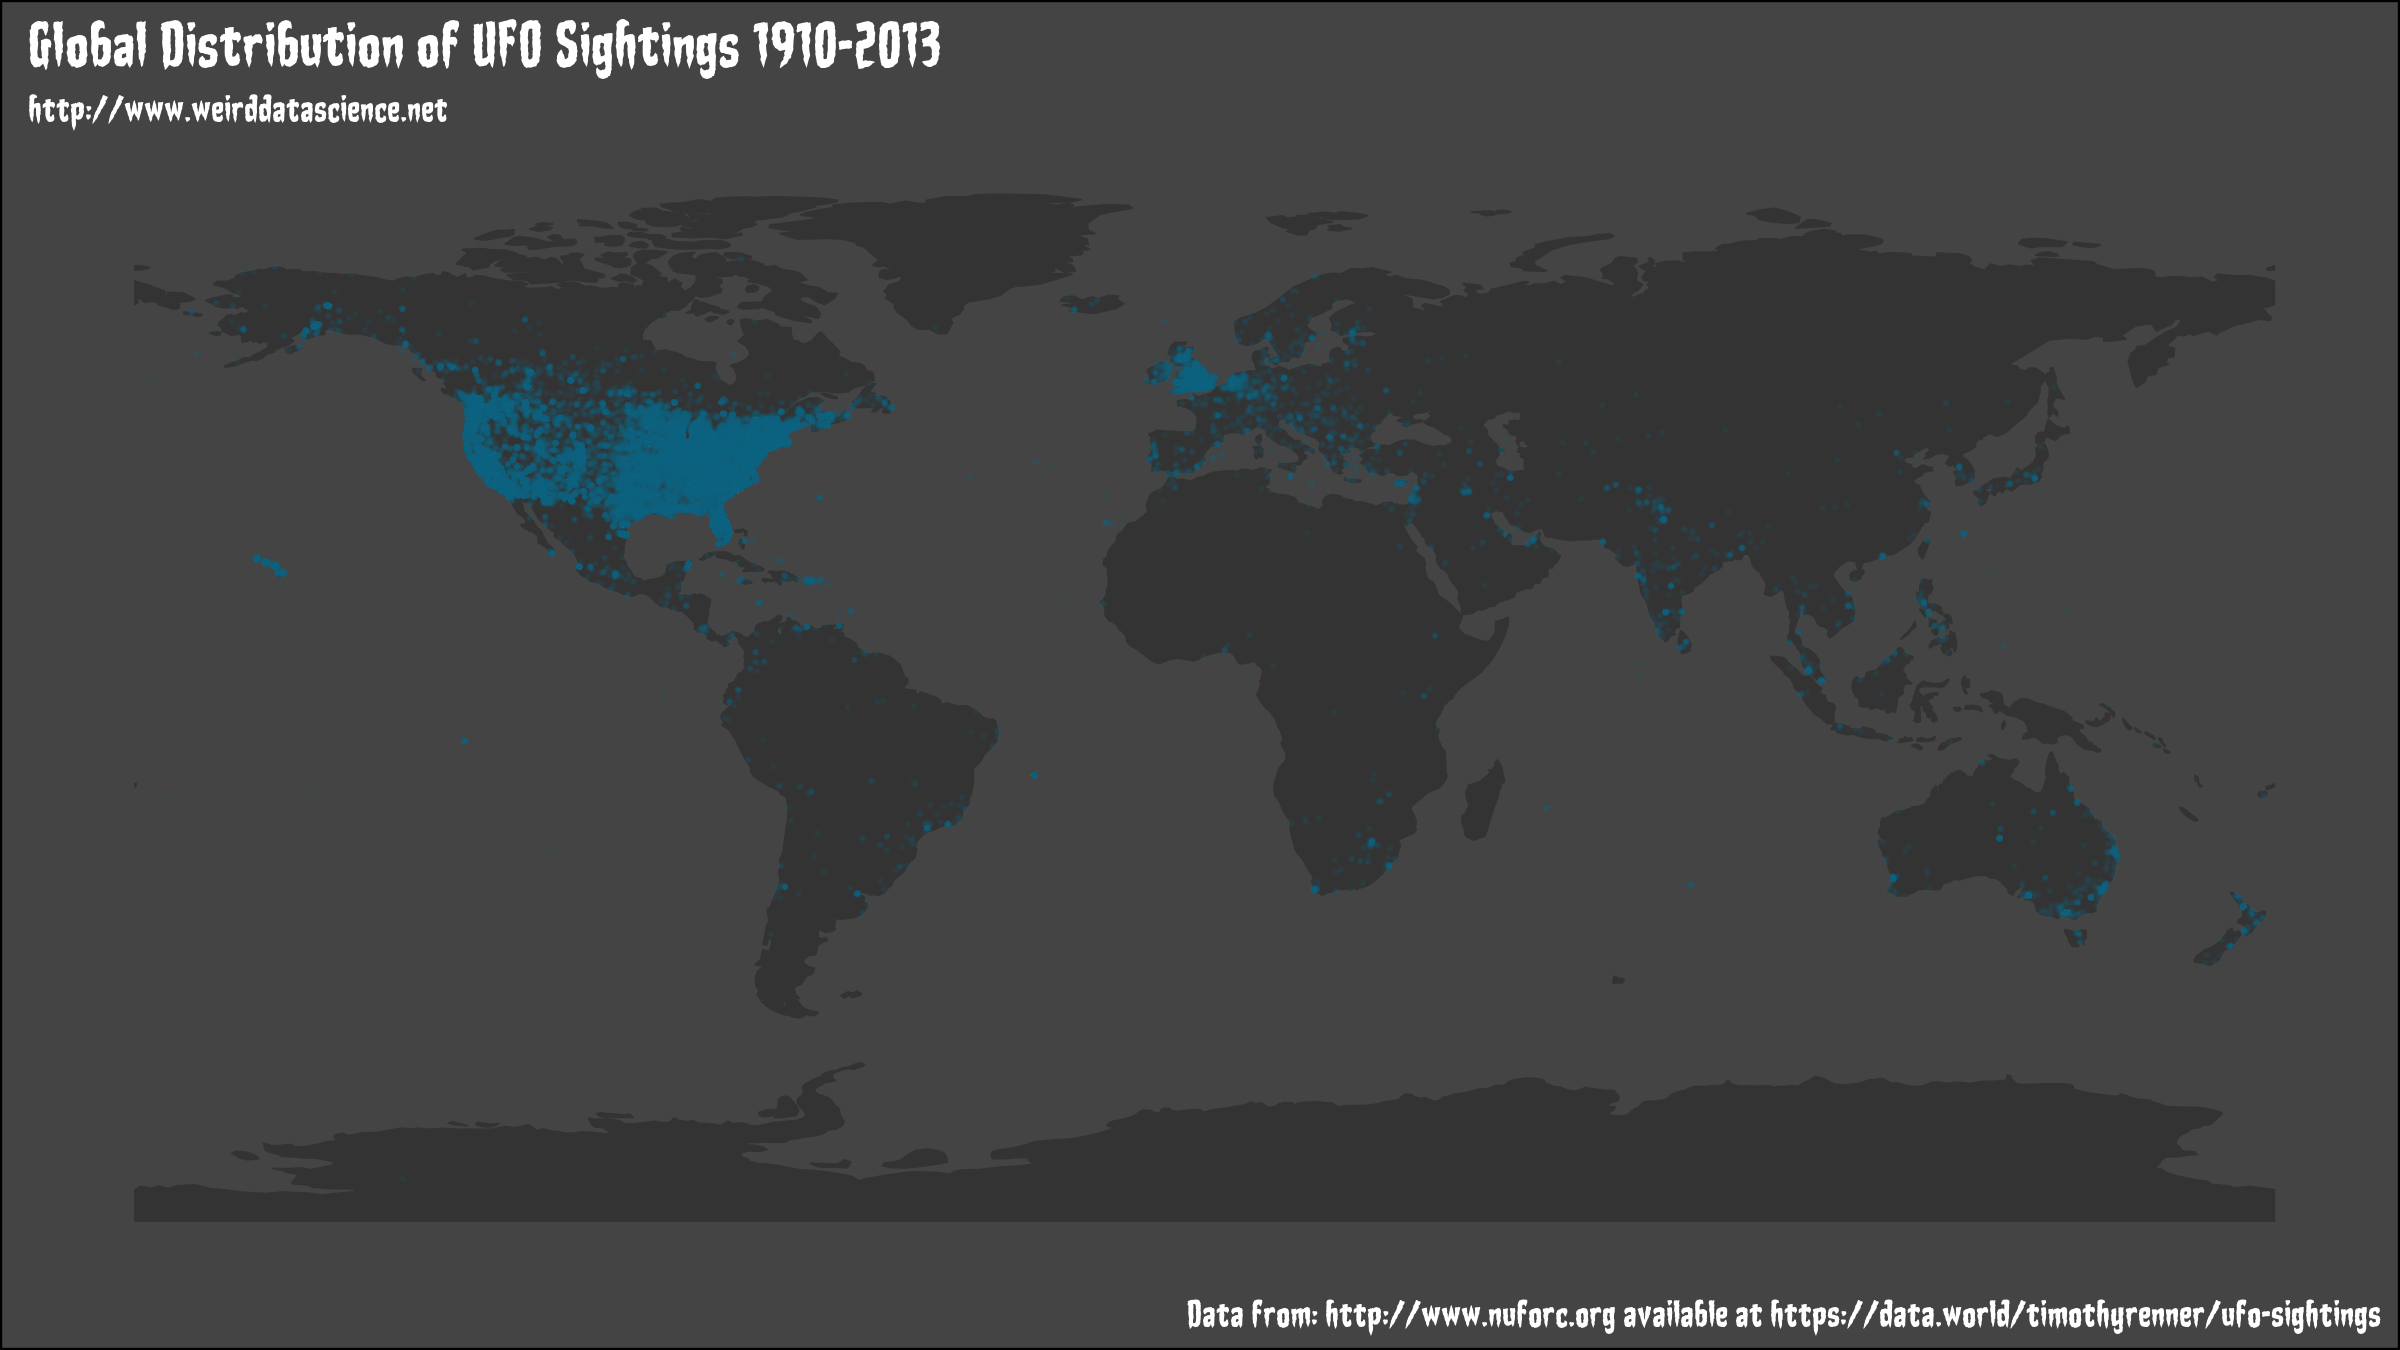
The full dataset is extremely detailed, with type of sighting, duration, latitude and longitude, and many other features included; there are many questions to ask of the data. As an initial offering for Weird Data Science, though, we will feed this dataset into R and get a feel for the global distribution of sightings in the dataset. The full code is at the bottom of this post, but here is the outcome:

What can we tell immediately? Firstly, there is a clear preference amongst UFO’s to descend on the United States, although Europe and in particular the United Kingdom receive their fair share of extraterrestrial visitations. The rest of the world is far from ignored, but our best hope of making contact would definitely seem to be in those two countries.

We will be analysing this dataset in much greater detail in the future. How have these sightings changed over time? Are there patterns to be discovered in when and where UFOs choose to reveal themselves? Are these events predictable? As always, the answers lie in the data.

You can keep up to date with our latest tinkerings with statistical reality on Twitter at @WeirdDataSci.

Show analysis code

Data:

Other:

Code:

[code language=”r”] library(ggplot2)
library(ggthemes)
library(maptools)
library(rgdal)
library(rgeos)
library(showtext)

# UFO Sightings Data
ufo <- read.csv("data/scrubbed.csv", stringsAsFactors=FALSE)

# Read world shapefile data and tranform to an appropriate projection
world <- readOGR( dsn=’data/ne/110m_cultural’, layer=’ne_110m_admin_0_countries’ )
world <- spTransform(world,CRS("+proj=longlat"))

# Fortify world data, using iso_a2 country codes
world.df <- fortify( world, region = "iso_a2" )

# Get list of unique countries for processing.
countries.all <- data.frame( unique(world.df$id)[-1])
colnames( countries.all ) <- c("country")

# Convert latitude and longitude to numeric, and omit result NA values.
ufo$latitude <- as.numeric(ufo$latitude)
ufo$longitude <- as.numeric(ufo$longitude)
ufo <- na.omit( ufo )

# Convert the ufo dataframe to a spatial dataframe that contains explicit longitude and latitude projected appropriately for plotting.
coordinates( ufo ) <- ~longitude+latitude
proj4string( ufo )<-CRS("+proj=longlat")
ufo <- spTransform(ufo,CRS(proj4string(ufo)))

# With the data appropriate projected for display, convert back to a data frame for ggplot2.
ufo<-data.frame(ufo)

# Show the map
gp <- ggplot() +
geom_map( data = countries.all, aes( map_id = country), colour = "grey20", size = 0.2, map = world.df ) +
expand_limits(x = world.df$long, y = world.df$lat)

# Display each sighting as geom_point. Use a level of transparency to highlight more common areas.
gp <- gp + geom_point(data=ufo, aes(x=longitude, y=latitude), color="#0b6788", size=0.1, alpha=0.1)

# Load font
font.add( "mapfont", "/usr/share/fonts/TTF/weird/StakeThroughtheHeartBB_reg.otf")
showtext.auto()

# Provide some overall theming of the map
gp <- gp +
theme_map() +
theme(
plot.background = element_rect(fill = "#444444"),
panel.border = element_blank(),
text = element_text( size=32, color="white", family="mapfont" ),
plot.title = element_text( size=48, colour="white", family="mapfont" )
)

gp <- gp + labs( caption = "Data from: http://www.nuforc.org available at https://data.world/timothyrenner/ufo-sightings" )

# Add our title
gp <- gp + ggtitle("Global Distribution of UFO Sightings 1910-2013", subtitle="http://www.weirddatascience.net")

# Save
ggsave("ufo-sightings.png", width=8, height=4.5)
[/code]

Be the first to comment

Leave a Reply

Your email address will not be published.


This site uses User Verification plugin to reduce spam. See how your comment data is processed.

This site uses Akismet to reduce spam. Learn how your comment data is processed.