Data:
Other:
Paranormal Database Scraping Code:
[code language=”r”]
library(rvest)
library(magrittr)
library(tidyr)
library(stringr)
library(dplyr)
# Base URL for scraping
paranormal.base <- "http://www.paranormaldatabase.com"
# Extract links from a given page. Return a list with full URLs.
extract.links <- function( in.html, base.url ) {
# Read the page and extract any links from the ‘hero-unit’ div.
# Extract all links, making relatives absolute.
in.html %>%
html_nodes( ‘.hero-unit’ ) %>%
html_nodes( ‘a’ ) %>%
html_attr( ‘href’ ) %>%
url_absolute( base.url )
}
# Function to extract a paranormal database entries page into a dataframe.
# Returns a dataframe of the entries from the given HTML.
extract.entries <- function( in.html ) {
# Select all table cells with a width of 100% — ugly, but identifies the
# entries themselves.
page.entries <- in.html %>%
html_nodes( xpath=’//td[ contains( @width, "100" ) ]’ ) %>%
html_text() %>%
str_replace_all( "[\r\n]" , "" )
# If any entries were found, process them.
if( ( length( page.entries ) > 0 ) &&
(str_detect(page.entries, "(.*[[:graph:]])\\s*Location: (.*[[:graph:]])\\s*Type: (.*[[:graph:]])\\s*Date / Time: (.*[[:graph:]])\\s*Further Comments: (.*[[:graph:]])\\s*")) ) {
# Each entry is a string containing:
# – Location:
# – Type:
# – Date / Time:
# – Further Comments:
# So split the string on these and put the entries into a dataframe.
page.entries.df <- data.frame( entry=page.entries) %>%
tidyr::extract(entry, into=c(‘title’, ‘location’, ‘type’, ‘date’, ‘comments’), "(.*[[:graph:]])\\s*Location: (.*[[:graph:]])\\s*Type: (.*[[:graph:]])\\s*Date / Time: (.*[[:graph:]])\\s*Further Comments: (.*[[:graph:]])\\s*" )
# Further split these into subtypes where appropriate. Both ‘location’ and ‘type’ are often split into a main and a subtype by a space-surrounded hyphen.
# As we’ll do this twice, make it a function. This takes a base column name, a new name for the sub-column, and the separator string.
coalesce.join <- function( base.data, base.column, sub.column, separator ) {
base.data <- base.data %>%
tidyr::extract( base.column, into=c("tmp.main", sub.column), separator, remove=FALSE)
# Combine the old base column with the new tmp.main column, using base.column to fill in the NAs in tmp.main
# where the separator was not matched.
base.data[ base.column ] <- coalesce( base.data[[ "tmp.main" ]], base.data[[ base.column ]] )
base.data <- base.data %>%
select(-one_of("tmp.main"))
}
# Split ‘type’
page.entries.df <- coalesce.join( page.entries.df, "type", "subtype", "(.*) – (.*)" )
page.entries.df <- coalesce.join( page.entries.df, "location", "sublocation", "(.*) – (.*)" )
page.entries.df
}
}
# Read each page’s links to populate a list to process.
# Each page contains a "Return to Regional Listing" link, and a link to enter the listings.
# That listing can be either a straight entries page, or a link to subpages.
# Starting with the base page, pull every link in the main ‘hero-unit’ div and
# add it to a ‘to.process’ vector, checking that that URL is not already
# listed. Also pass along a ‘processed’ vector in the recursive calls so that
# we don’t overly duplicate results.
# WARNING: As written, this will cause a lot of duplication due to the lack of
# global list of processed links. As this was a one-off script, I haven’t fixed this.
# Base URL to being processing
paranormal.regions <- "http://www.paranormaldatabase.com/regions/regions.htm"
# Recursively process the top-level URL
scrape.recurse <- function( in.url, processed ) {
message( paste("Processing", in.url ) )
# Try to fetch this URL and any subpages.
# Warn on failure
page <- tryCatch(
{
# Fetch and parse HTML of current page.
read_html( in.url )
},
error=function( cond ) {
message( paste( "URL caused an error:", in.url ))
message( "Error message:")
message( cond )
return( NULL )
},
warning=function( cond ) {
message( paste( "URL caused a warning:", in.url ))
message( "Warning message:")
message( cond )
return( NULL )
},
finally={
}
)
if( is.null( page ) ) {
return( NULL )
}
else {
# Get the current page’s entries
links <- extract.links( page, in.url )
entries <- extract.entries( page )
lapply( entries$title, function(x) cat( x, "… ", sep="" ) )
cat( "\n")
# Recurse, but don’t follow any known links
new.entries <-
lapply( setdiff( links, processed ), function(x) scrape.recurse( x, union( links, processed ) ) ) %>%
bind_rows()
# Bind entries from sub-pages to this page’s entries.
all.entries <- bind_rows( entries, new.entries )
# Report success and return results
message( paste( "Successfully processed:", in.url ) )
return( all.entries )
}
}
# Run the scraping and parsing, then remove duplicates.
all.entries <- scrape.recurse( paranormal.regions, paranormal.regions )
paranormal.df <- unique( all.entries )
# Manually fix some type entries.
paranormal.df$type[ which( paranormal.df$type == "legend" ) ] <- "Legend"
paranormal.df$type[ which( paranormal.df$type == "Haunting Manifestation?" ) ] <- "Haunting Manifestation"
paranormal.df$type[ which( paranormal.df$type == "SHC" ) ] <- "Spontaneous Human Combustion"
paranormal.df$type[ which( paranormal.df$type == "ABC" ) ] <- "Alien Big Cat"
# With all values scraped, save data.
save( paranormal.df, file="paranormal.Rdata")
[/code]
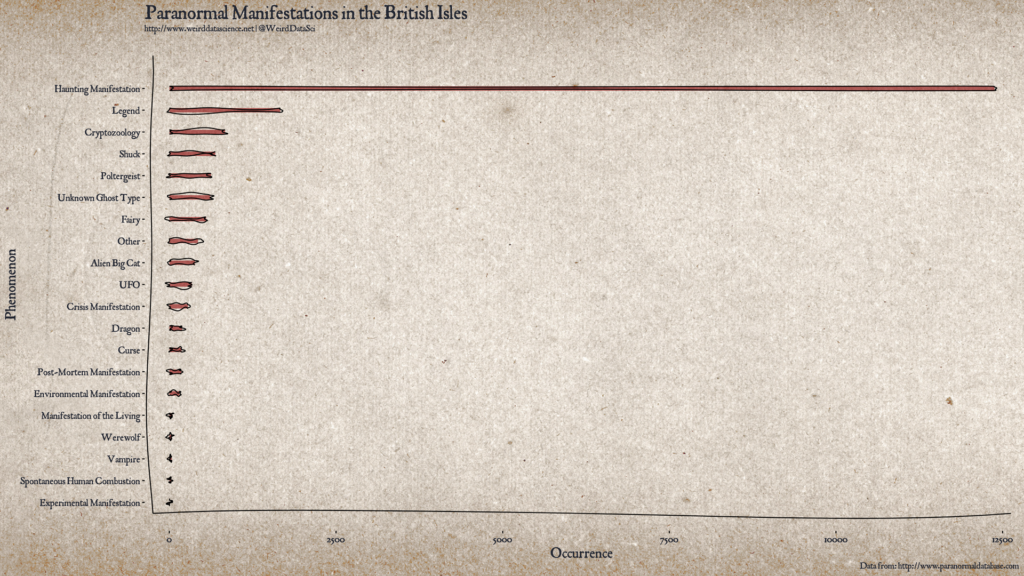
Paranormal Manifestations in the British Isles Plotting Code:
[code language=”r”]
library(ggplot2)
library(jpeg)
library(xkcd)
library(showtext)
library(grid)
library(gridExtra)
# Create a summary barplot for paranormal activity in the UK.
# Load the data from scraping http://www.paranormaldatabase.com/
load( "../data/paranormal.Rdata" )
# Process the data to frequency counts of each type of event.
counts <- table( paranormal.df$type )
df <- as.data.frame.table( sort(counts, decreasing=FALSE) )
colnames( df ) <- c("type", "frequency" )
# Create the plot.
# Use the xkcd package to create irregular bars for a hand-drawn look.
df$xmin <- 1
df$xmax <- df$frequency
df$ymin <- as.numeric(df$type) – 0.1
df$ymax <- as.numeric(df$type) + 0.1
xrange <- range( min( df$xmin ), max( df$xmax ) )
yrange <- range( min( df$ymin ), max( df$ymax ) + 1 )
mapping <- aes( xmin=xmin, ymin=ymin, xmax=xmax, ymax=ymax )
# Load font
font_add( "handwriting", "/usr/share/fonts/TTF/weird/JANCIENT.TTF" )
showtext_auto()
# Load background image.
bg.image <- jpeg::readJPEG("img/vellum.jpg")
bg.grob <- rasterGrob( bg.image, interpolate=TRUE,
width = 1.8,
height = 1.4 )
gp <- ggplot( data=paranormal.df, aes( x=frequency, y=type ) ) +
annotation_custom( bg.grob, xmin=-Inf, xmax=Inf, ymin=-Inf, ymax=Inf ) +
xkcdrect( mapping, df, alpha=0.6, fill="#8a0707", size=1 ) +
xkcdaxis( xrange, yrange ) +
theme(
text = element_text( size=12, color="#232732", family="handwriting" ),
plot.background = element_rect(fill = "transparent", color="transparent"),
panel.background = element_rect(fill = "transparent", color="transparent"),
plot.title = element_text( size=24, colour="#232732", family="handwriting" ),
axis.title = element_text( size=18, colour="#232732", family="handwriting" ),
axis.text.x=element_text( size=12, color="#232732", family="handwriting" ),
axis.text.y=element_text( size=12, color="#232732", family="handwriting", hjust=1) ) +
scale_y_discrete( labels=c( as.character( df$type ) ) ) +
scale_x_continuous( expand = c( 0, 0 ) ) +
ylab( "Phenomenon" ) +
xlab( "Occurrence" ) +
labs( caption = "Data from: http://www.paranormaldatabase.com" ) +
ggtitle("Paranormal Manifestations in the British Isles", subtitle="http://www.weirddatascience.net | @WeirdDataSci")
# To allow the background image to extend to the edge of the panel, we have to generate
# a gtable directly from gp, then turn off clipping.
p2 <- ggplot_gtable(ggplot_build(gp))
p2$layout$clip[p2$layout$name=="panel"] <- "off"
# To create the output, we need to call grid.draw on the gtable.
# Use the pdf device to draw directly to preserve clipping and fonts.
# showtext has to be called explicitly in here, for some reason.
pdf( file="output/haunting.pdf", width=16, height=9 )
showtext_begin()
grid.draw(p2)
showtext_end()
dev.off()
[/code]


1 Trackback / Pingback
-
Mapping Paranormal Manifestations in the British Isles | Weird Data Science
This site uses User Verification plugin to reduce spam. See how your comment data is processed.