
In earlier analyses of the UFO phenomenon, based on the NUFORC dataset, we have examined the global density of sightings, and the relative distribution of sightings against the location of military bases in the United States. All of these analyses have, however, considered individual sightings to be more or less equivalent.
The NUFORC dataset, however, provides much more detailed information on individual sightings. The most significant immediate feature of each report, beyond its time and location, is the recorded shape of each object. Was the reported UFO saucer-shaped? Triangular? A flash of light? Or did the individual see more more than one object moving in formation? By considering this aspect of the data we can interrogate more closely the nature of UFO sightings over the years.
The NUFORC dataset classifies each sighting as one of 46 possible shapes, with approximately three percent of entries not being classified directly. Of those 46, several categories overlap each other; “Triangle”, “triangle”, and “Triangular” are all, for example, possibilities. Additionally, the dataset contains both “other” and “unknown” categories.
With a minimal level of cleaning we are left with 26 categories, including the familiar circular objects, but also “crescent” (2 entries), “hexagon” (1 entry), and “cross” (356 entries). For easier representation and analysis, we have collapsed several infrequent and similar categories together, resulting in eight top-level categories distributed in the following way:
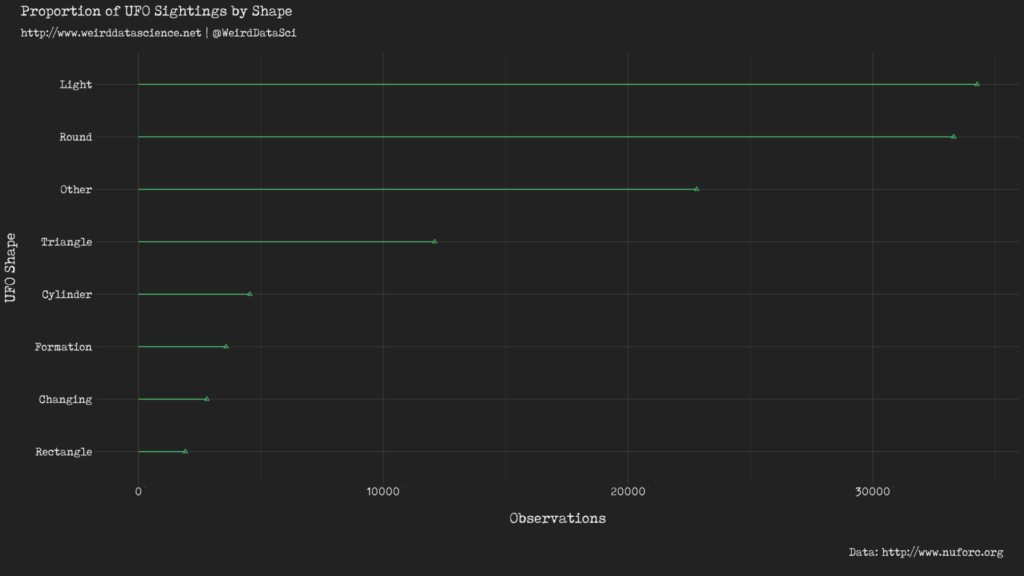
We can clearly see from this that lights are the most commonly-reported extraterrestrial manifestation, closely followed by the category of “round” objects that most closely matches, perhaps, the traditional concept of a UFO sighting. This category does, however, extend to spheres, disks, ovals, domes, eggs, and cones.
This breakdown of frequency is somewhat deceptive: the sightings reported in the NUFORC database span from a reported 1400CE (a roughly-dated cave painting in Texas depicting a saucer-shaped object) to the present day. For reliability, we have discounted reports prior to 1900CE from our analysis. In our data, then, are these sightings consistent over time? Has the form and nature of our extraterrestrial visitors shifted in recent history? Are we naively assuming that all objects are from the same source, and with similar intentions?
At the most mundane level, the total volume of sightings has sharply increased since the early reports in the dataset. The total number of reported sightings in the 1940s was 144 in total, compared with 4934 sightings in 2017 alone, and a peak of 8651 sightings in 2014.
Broken down by category, the total number of sightings since 1945 is shown below. We have removed sightings prior to 1945 from this diagram, as they were sufficiently low in volume that they were not visible. The most marked rise in sightings begins in the mid-1990s, with 502 sightings in 1994 rising to 1467 in 1995, with the overall rising trend following until its peak in 2014.
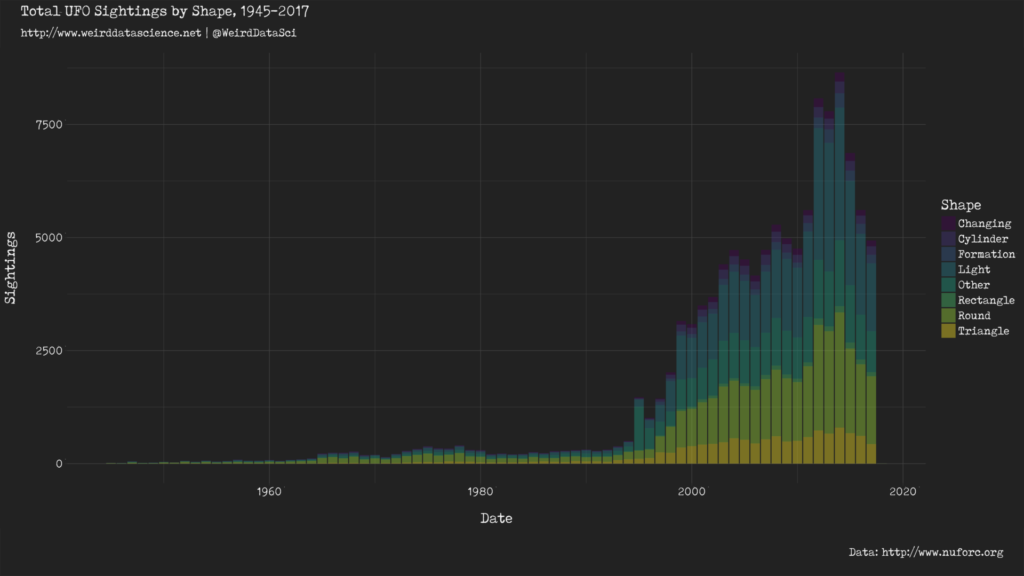
To understand the specific nature of visitations, however, it is useful to view sightings as a proportion of the total, rather than their absolute numbers.
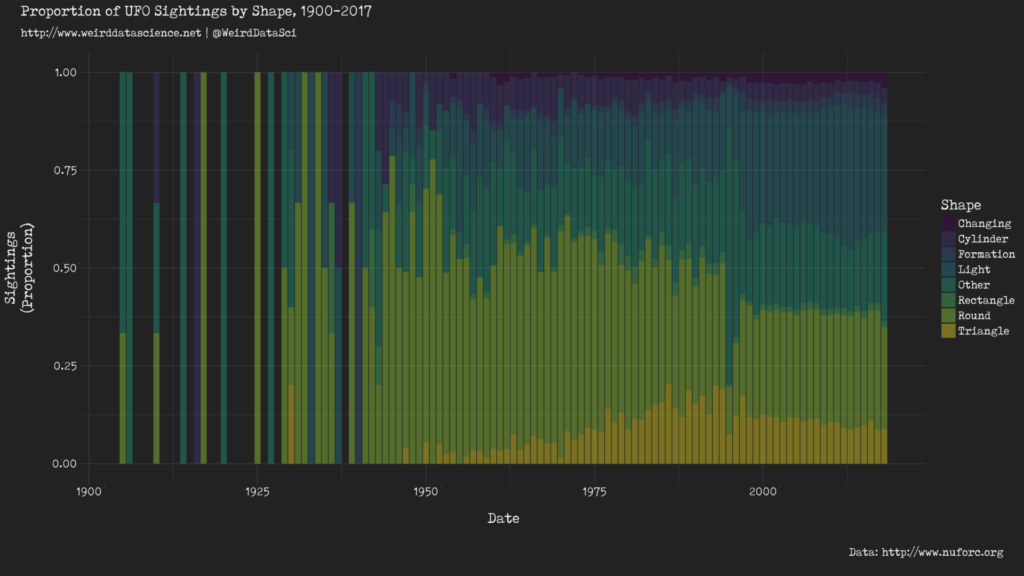
It is clear that, allowing for the overall increase in numbers, the proportion of generically round UFOs has reduced since the 1950s, when they clearly dominated. The most significant increase has been the rise in triangular sightings, including “delta” and “chevron” shaped craft. This conceivably tracks the development of terrestrial military aircraft towards “delta wing” and similar profiles.
Since the mid-90s there have been a marked increase in sightings reported simply as “lights” — flashes, fireballs, flares, and similar. From 2000 onwards, the relative proportions appear to be mainly steady.
For specific cases, 1995 shows an oddly large proportion of unclassified “other” sightings, although these do not seem to be the result of any particular event. The highest proportion of these are in Seattle, with 38 sightings, but are spread fairly evenly throughout the year.
Breaking down sightings according to specific times, rather than year-by-year reveals some other points of interest. Firstly, sightings by month:
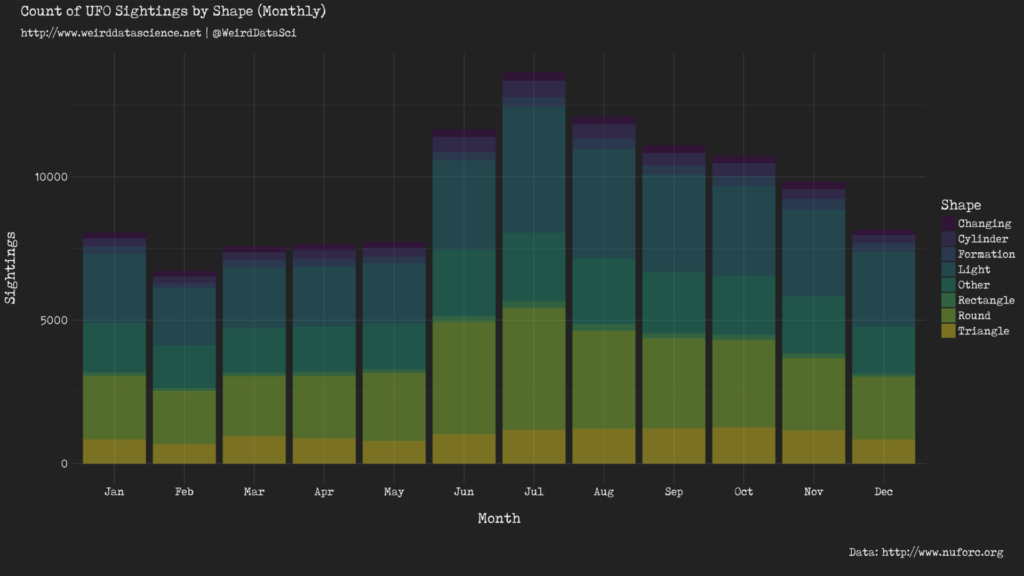
Sightings are much more common in the Northern hemisphere’s summer months, presumably due to higher numbers of people spending time outside and being in a position to spot anomalous phenomena.
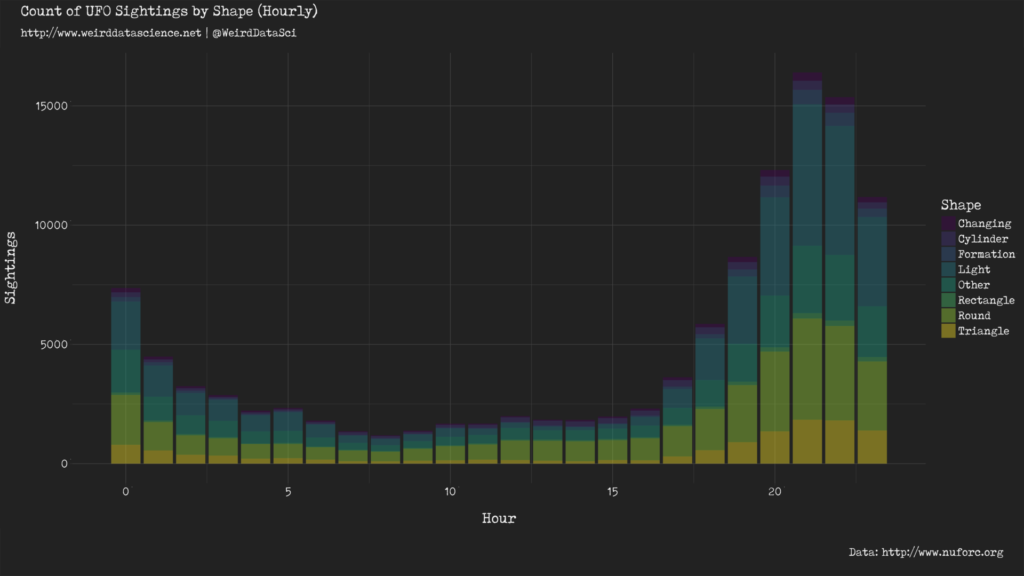
Breaking down sightings by hour, we can see that sightings are far more common at night than during the day, with the lowest volumes of sightings around 08:00, and the highest at 21:00. For both monthly and hourly sightings, the relative proportions of sightings by shape remain relatively constant. We can conclude that UFOs’ activity is unrelated to their shape. This consistency of behaviour suggests that, regardless of their shape, the various forms of UFO, however they disguise themselves, may be drawn from a single source.
This is far from a definitive breakdown of UFO behaviour by their shape. In future posts we will explore whether differing shapes of UFO cluster geographically, and the extent to which cotemporaneous sightings can be correlated by their shape and description.
You can keep up to date with our latest statistical esoterica on Twitter at @WeirdDataSci.
As always, keep delving.
Code Note:
In developing this entry we have moved from using the excellent work of Tim Renner in gathering and cleaning the NUFORC UFO dataset, and developed our own scraping code. Most posts here have included source code at the bottom of each entry. As this post relied on more than the usual code, however, and included multiple outputs, we are including only representative code. The full scraping and analysis code will be the focus of a future post.

1 Trackback / Pingback
-
An overview of various forms of UFO evidence – AI Driven UFO / UAP Reporting Tool
This site uses User Verification plugin to reduce spam. See how your comment data is processed.